Free lesson · Edexcel Economics A · 1.2.3, 1.2.5
Income, cross and supply elasticities
A supermarket’s sales depend on household income and competitors’ prices as well as its own prices. Income elasticity of demand, or YED, measures percentage change in quantity demanded divided by percentage change in income. Positive YED identifies a normal good; negative YED identifies an inferior good. “Inferior” describes the income relationship, not poor physical quality.
Normal necessities typically have YED between zero and one. Luxury goods have YED above one: demand changes more than proportionately with income. If income rises 5% and restaurant visits rise 10%, YED = 10 ÷ 5 = 2. In a recession, the same sensitivity creates a risk of a sharp fall in sales. A budget food whose demand falls 2% when income rises 4% has YED = −0.5.
Cross elasticity of demand, or XED, measures percentage change in demand for good A divided by percentage change in the price of good B. Positive XED suggests substitutes; negative XED suggests complements; a value near zero suggests little relationship. If rail fares rise 10% and coach demand rises 6%, XED is +0.6. If printer prices rise 8% and ink demand falls 4%, XED is −0.5.
These measures help firms choose product ranges and anticipate rival actions. High positive XED indicates competitive pressure, while a strong negative XED makes complementary pricing important. Governments can use YED to anticipate changes in demand for services as real incomes grow. Estimates still depend on market definitions and other influences being held constant.
Price elasticity of supply, or PES, measures percentage change in quantity supplied divided by percentage change in price. If price rises 10% and supply rises 15%, PES = 1.5: supply is elastic. Values below one indicate inelastic supply, one indicates unit elasticity, zero means perfectly inelastic supply and a horizontal supply curve represents perfectly elastic supply.
Spare capacity, stocks, storage, production time and factor mobility determine responsiveness. A hotel with empty rooms can accommodate extra guests quickly; building a new hotel takes much longer. In the short run at least one production factor is fixed. In the long run all factors can vary. These are economic definitions, not fixed calendar intervals.
Price elasticity of supply
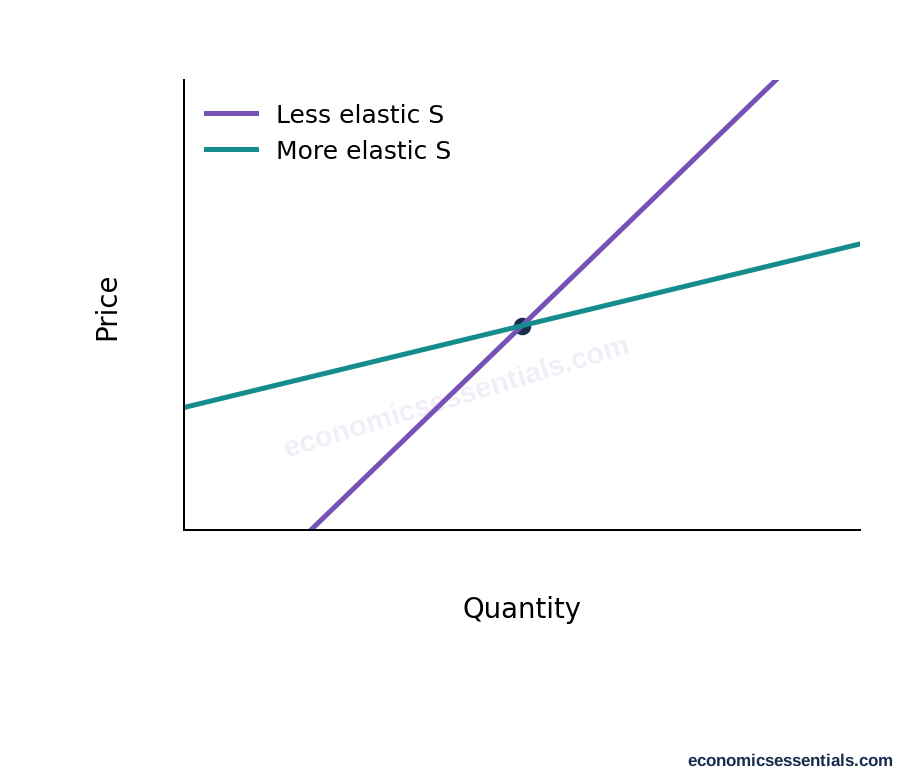
Both supply curves pass through the marked point. Around that point, the flatter curve gives a larger proportional quantity response to a price change. The comparison assumes consistent axis scales.
Evaluation links demand and supply elasticities. When demand increases against inelastic supply, much of the adjustment appears as a higher price rather than extra output. Training workers, improving storage or expanding capacity may increase responsiveness later. Do not infer elasticity from a curve’s visual steepness alone: scale and the point being considered matter. Always calculate the percentage changes, retain the economically meaningful sign and explain what the result means for decisions.
Key terms
- Income elasticity of demand
- Percentage change in quantity demanded divided by percentage change in income.
- Cross elasticity of demand
- Percentage change in demand for one good divided by percentage change in another good’s price.
- Price elasticity of supply
- Percentage change in quantity supplied divided by percentage change in price.
- Inferior good
- A good whose demand falls as income rises, other things equal.
- Complementary goods
- Goods consumed together, so a higher price of one tends to reduce demand for the other.