Free lesson · Edexcel Economics A · 4.2.1, 4.2.2
Poverty, inequality and the Lorenz curve
Poverty and inequality describe related but different problems. Absolute poverty means inadequate resources to meet a defined basic-needs standard. Relative poverty compares resources with the prevailing living standard, often using a proportion of median equivalised household income. Thresholds depend on the measure, price basis and household adjustments, so always state the definition used.
Income is a flow of earnings, benefits and other receipts over time. Wealth is a stock of assets minus liabilities. Wealth inequality is often more pronounced because assets accumulate and can be inherited. Two households with similar current incomes may have very different security if one owns a home and savings while the other has debt.
Worked example: suppose a relative-poverty line is defined as 60% of median income. If median income is £30,000, the line is £18,000. If every income rises 10%, the line rises to £19,800. A household initially below the threshold can remain relatively poor despite higher real resources, depending on inflation. Absolute poverty can fall while relative poverty is unchanged.
The Lorenz curve plots cumulative population, ordered from poorest to richest, against cumulative income. The 45-degree line represents complete equality. A curve further below it indicates greater inequality when curves do not cross. The Gini coefficient equals the area between the equality line and Lorenz curve divided by the total area below the equality line. It ranges from zero for equality towards one for extreme concentration, sometimes reported on a 0–100 scale.
For five equal population groups with income shares 5%, 10%, 15%, 25% and 45%, cumulative shares are 5%, 15%, 30%, 55% and 100%. These points construct a grouped-data Lorenz curve. Trapezoidal calculation gives an approximate Gini of 0.38. Grouped data hide inequality within each group, so the estimate is not an exact individual-level measure.
Lorenz curve and Gini coefficient
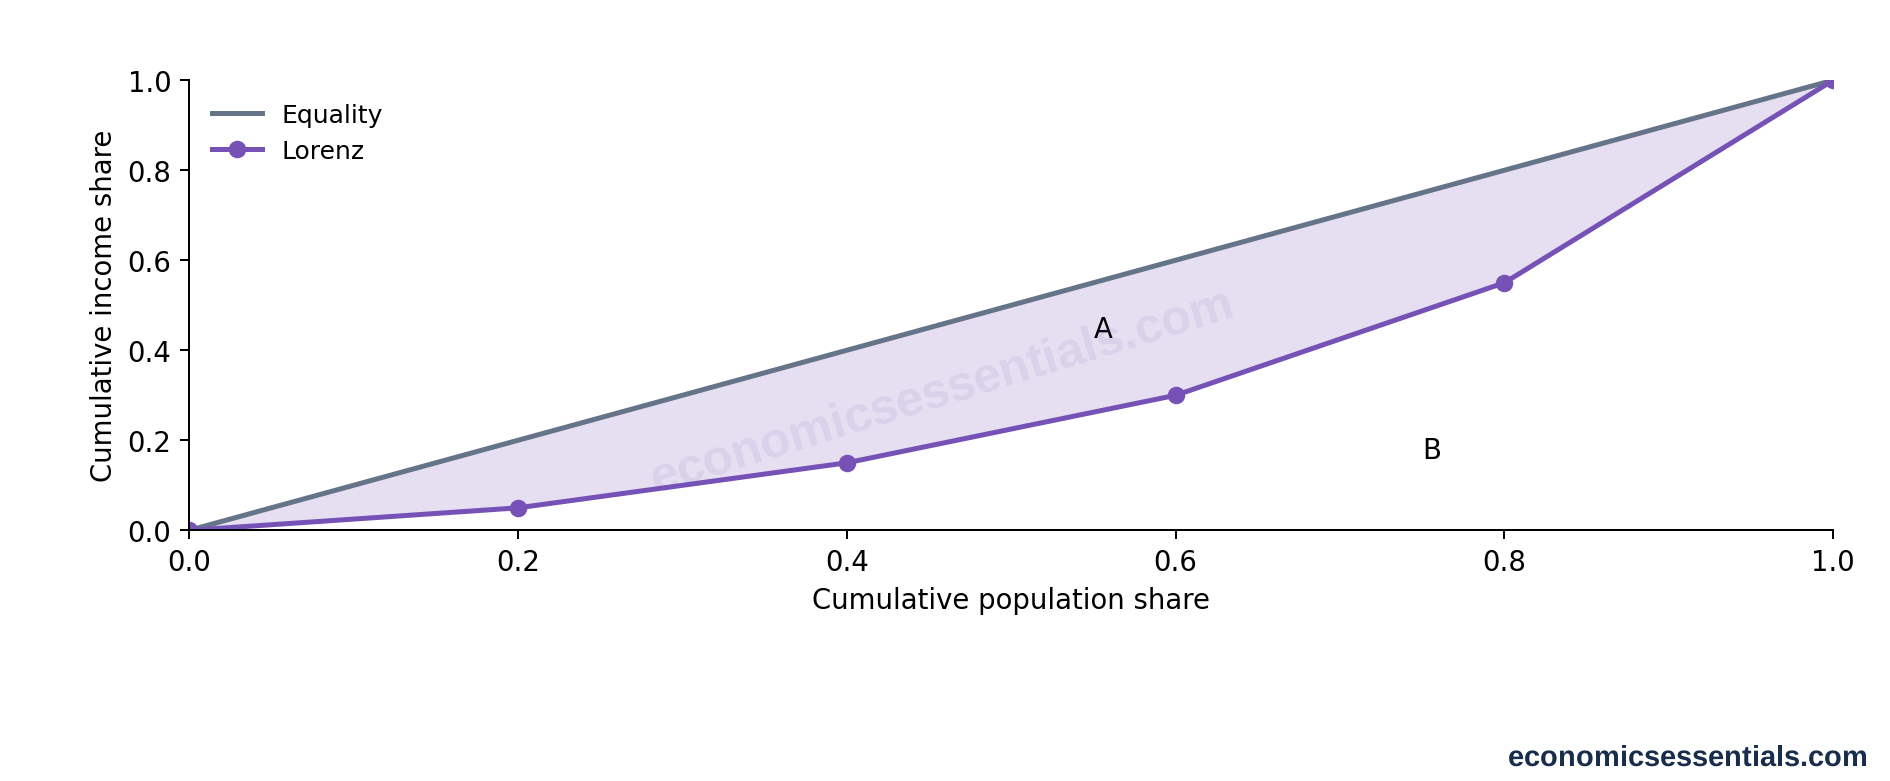
Cumulative income shares are 0, 5, 15, 30, 55 and 100 percent at population shares 0, 20, 40, 60, 80 and 100 percent. Gini equals A divided by A plus B. Trapezoidal grouped-data calculation gives 0.38 here.
Causes include differences in skills, employment, discrimination, asset ownership, inheritance, bargaining power and access to education or credit. Between-country inequality reflects productivity, institutions, health, infrastructure and historical conditions. Technological change and globalisation can raise rewards for some skills while weakening demand for others.
Capitalism can generate investment and innovation but also unequal returns to ownership and market power. Taxation, transfers and public services influence how market incomes translate into living standards. Development does not follow a guaranteed inequality path: institutions and policy choices matter.
Evaluation should distinguish inequality from deprivation. A policy can reduce the Gini while leaving very poor households little better off, or reduce poverty while inequality rises. Assess disposable resources, access to services and wealth as well as averages. The strongest judgement identifies which group gains, whether opportunities improve and whether the change can be sustained.
Key terms
- Absolute poverty
- Insufficient resources to meet a defined basic-needs threshold.
- Relative poverty
- Low resources compared with prevailing living standards in a society.
- Income
- A flow of earnings or receipts over a period.
- Wealth
- A stock of assets minus liabilities at a point in time.
- Gini coefficient
- A measure of distributional inequality derived from the Lorenz curve.